Strategy & sensemaking
Visual Sensemaking
How I use visual artefacts in projects, collaboration and portfolio design
01 / 04
Complexity dissected through animation
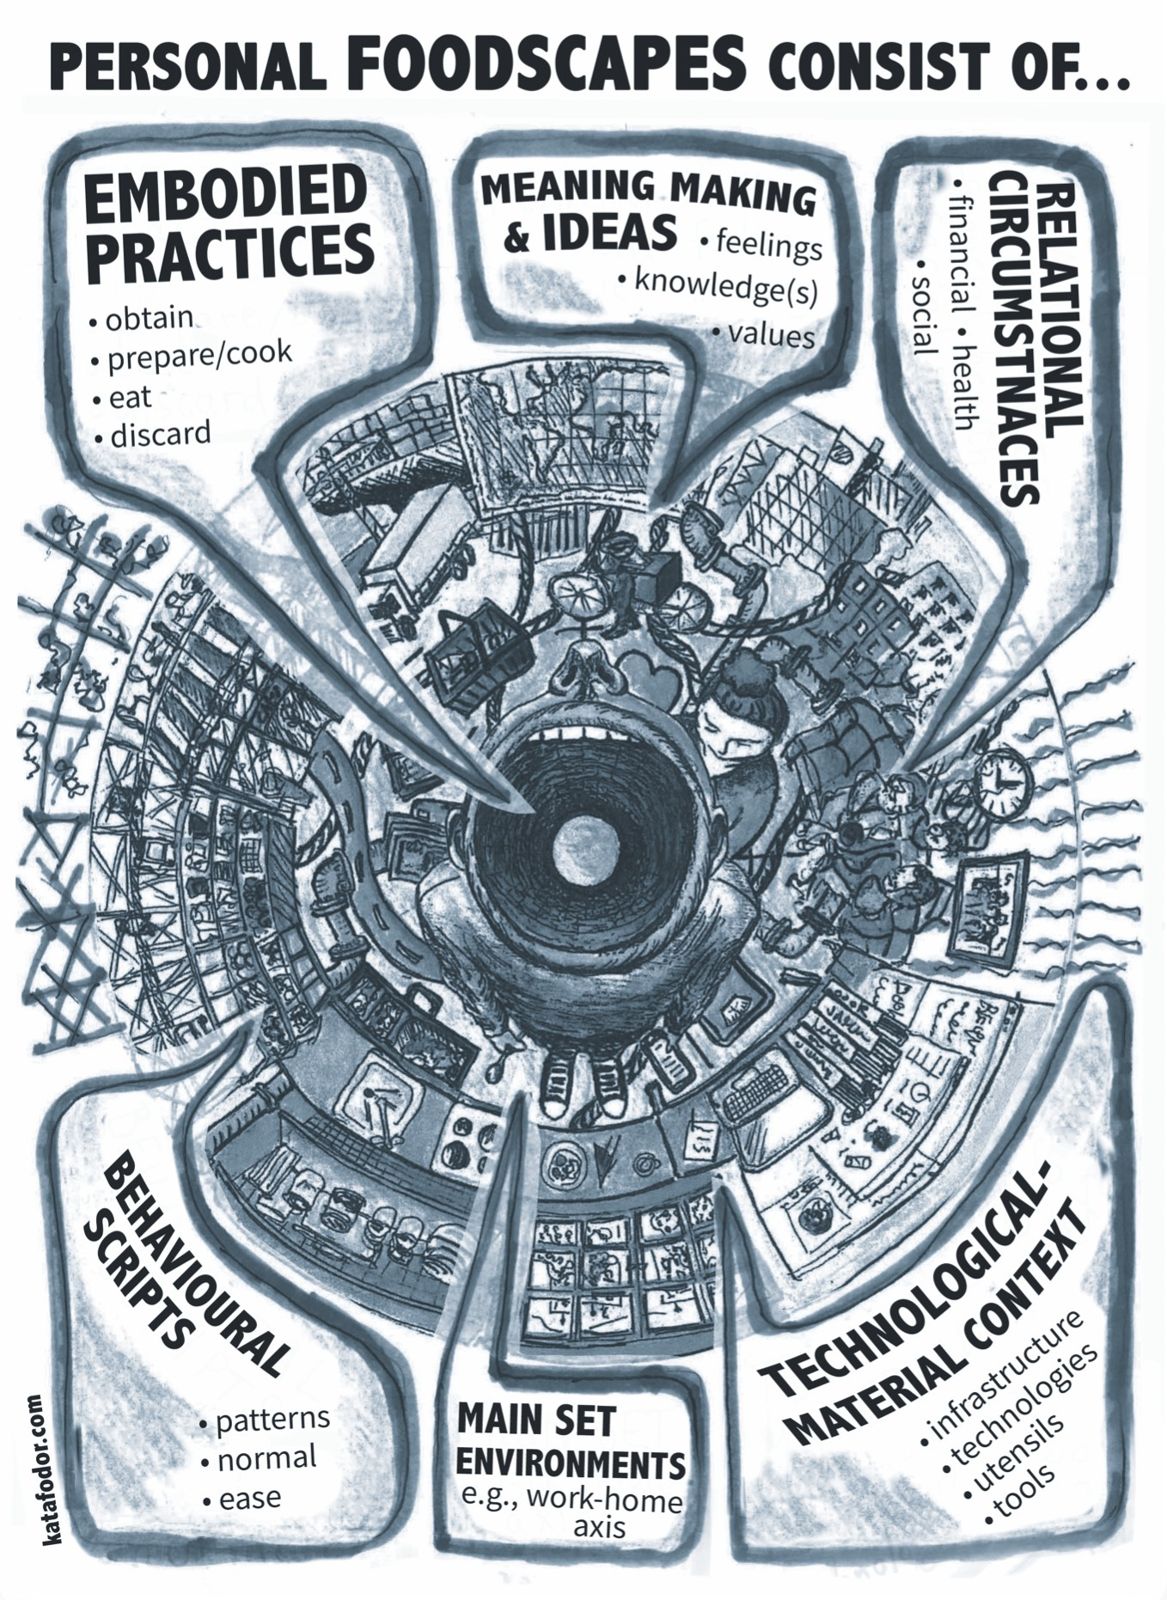
I created this animation to visualise the many layers and scales of urban foodscapes – showcasing all the elements, systems and technologies that operate between urban consumers and their food.
Outtake from my exhibition at Helsinki Design Week 2022
02 / 04
Spatial models & scenes
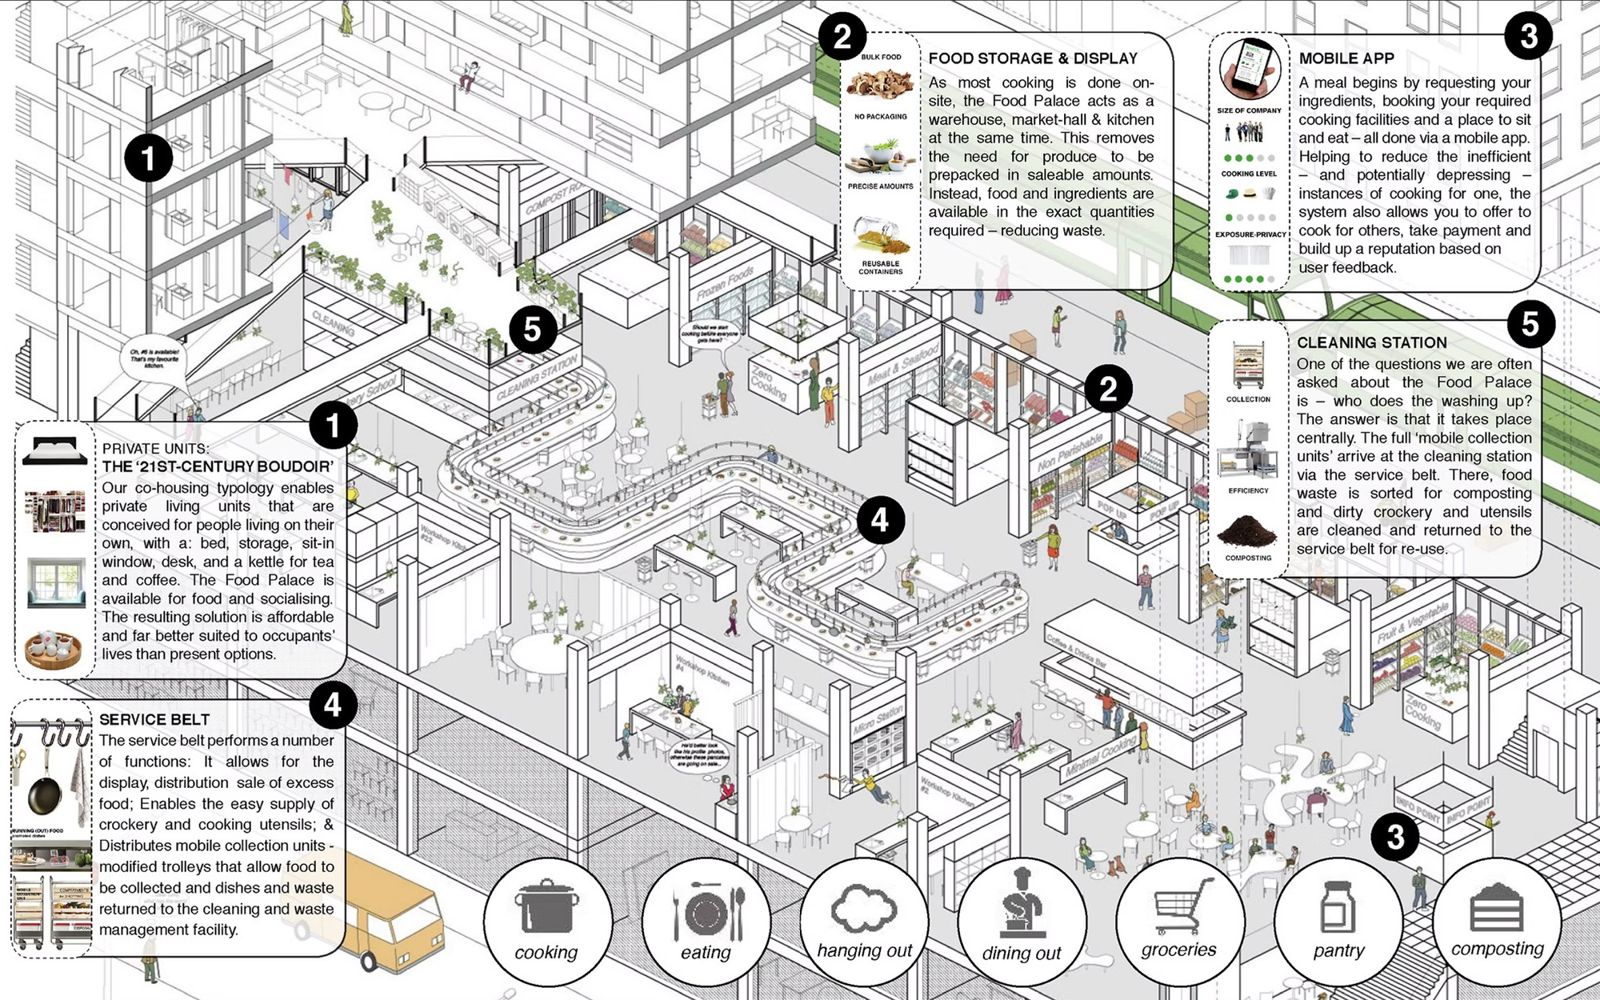
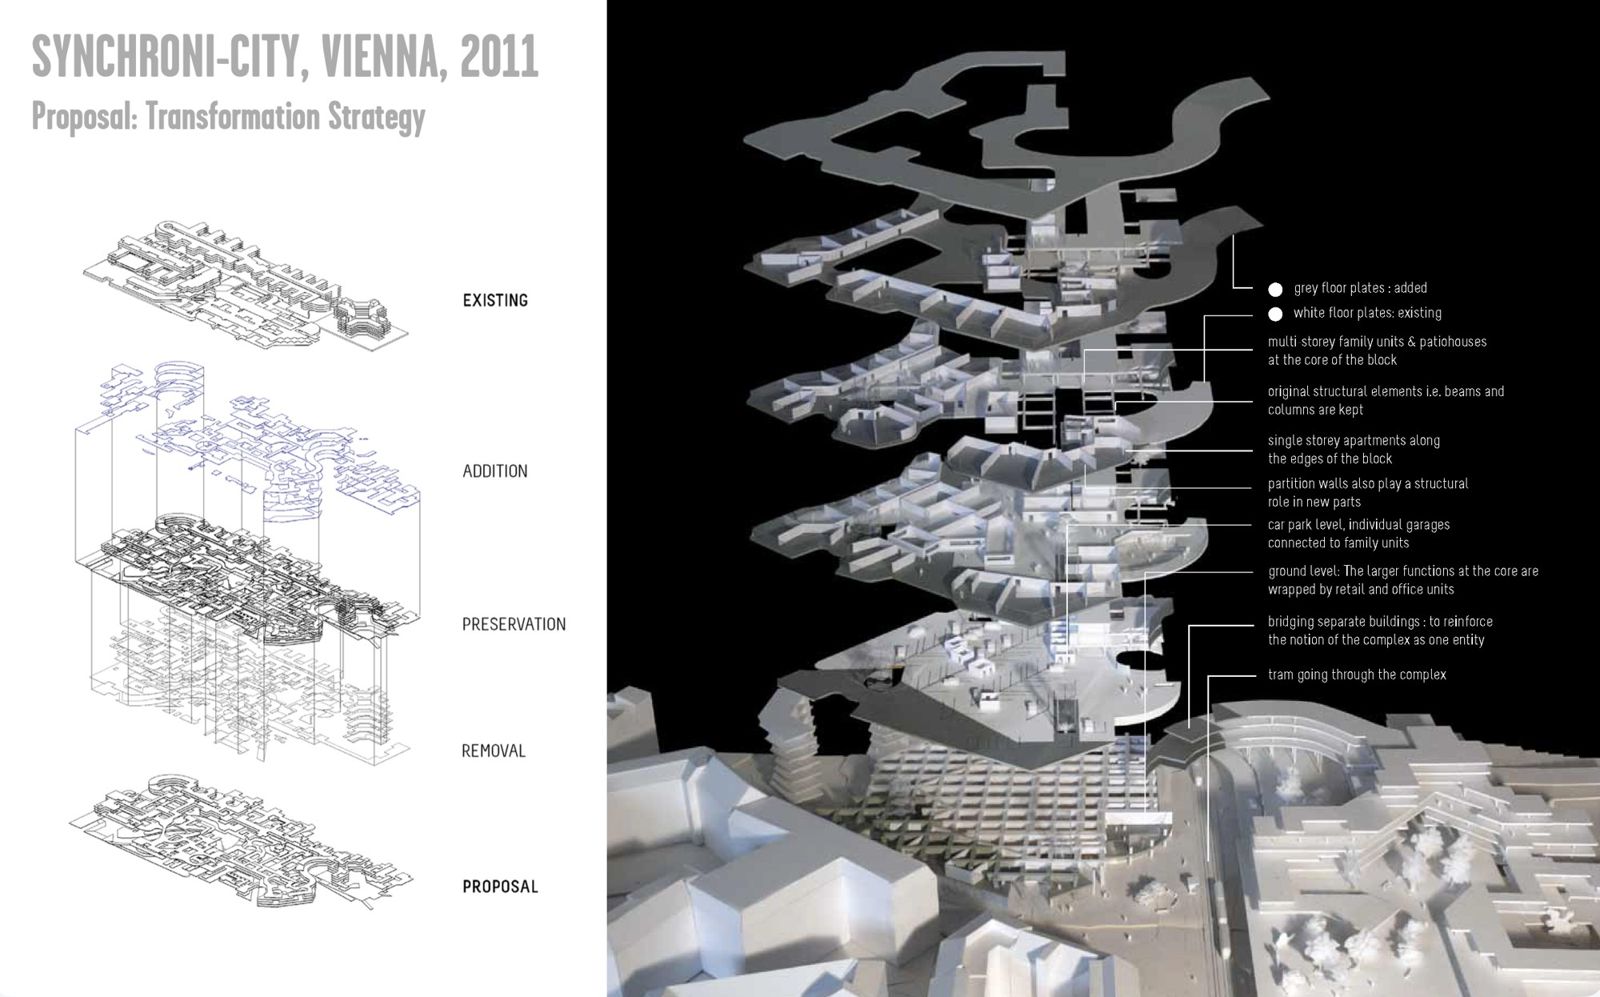
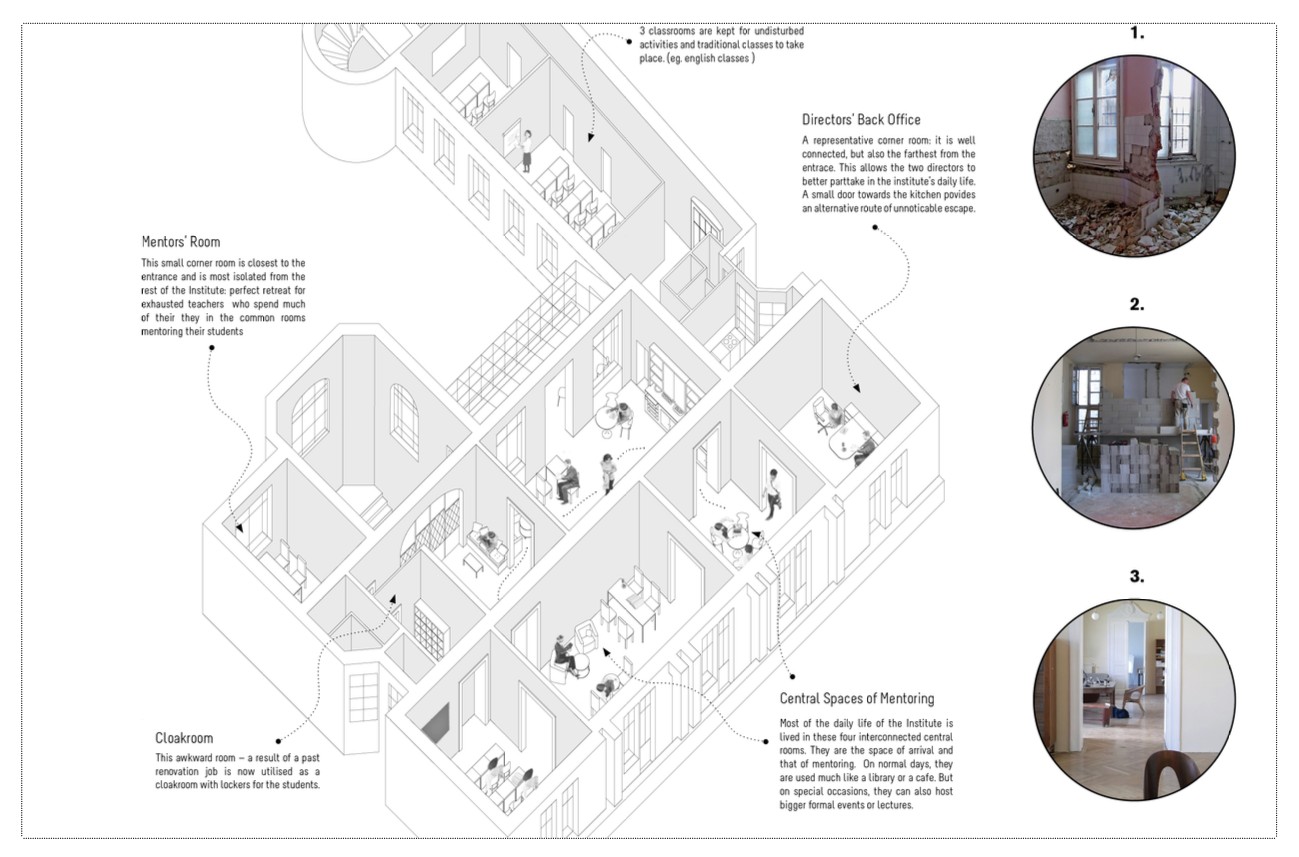
I often use spatial models and representations to explain systems, processes and visions. These cartoonish situations make complex challenges and phenomena tangible for wider audiences.
03 / 04
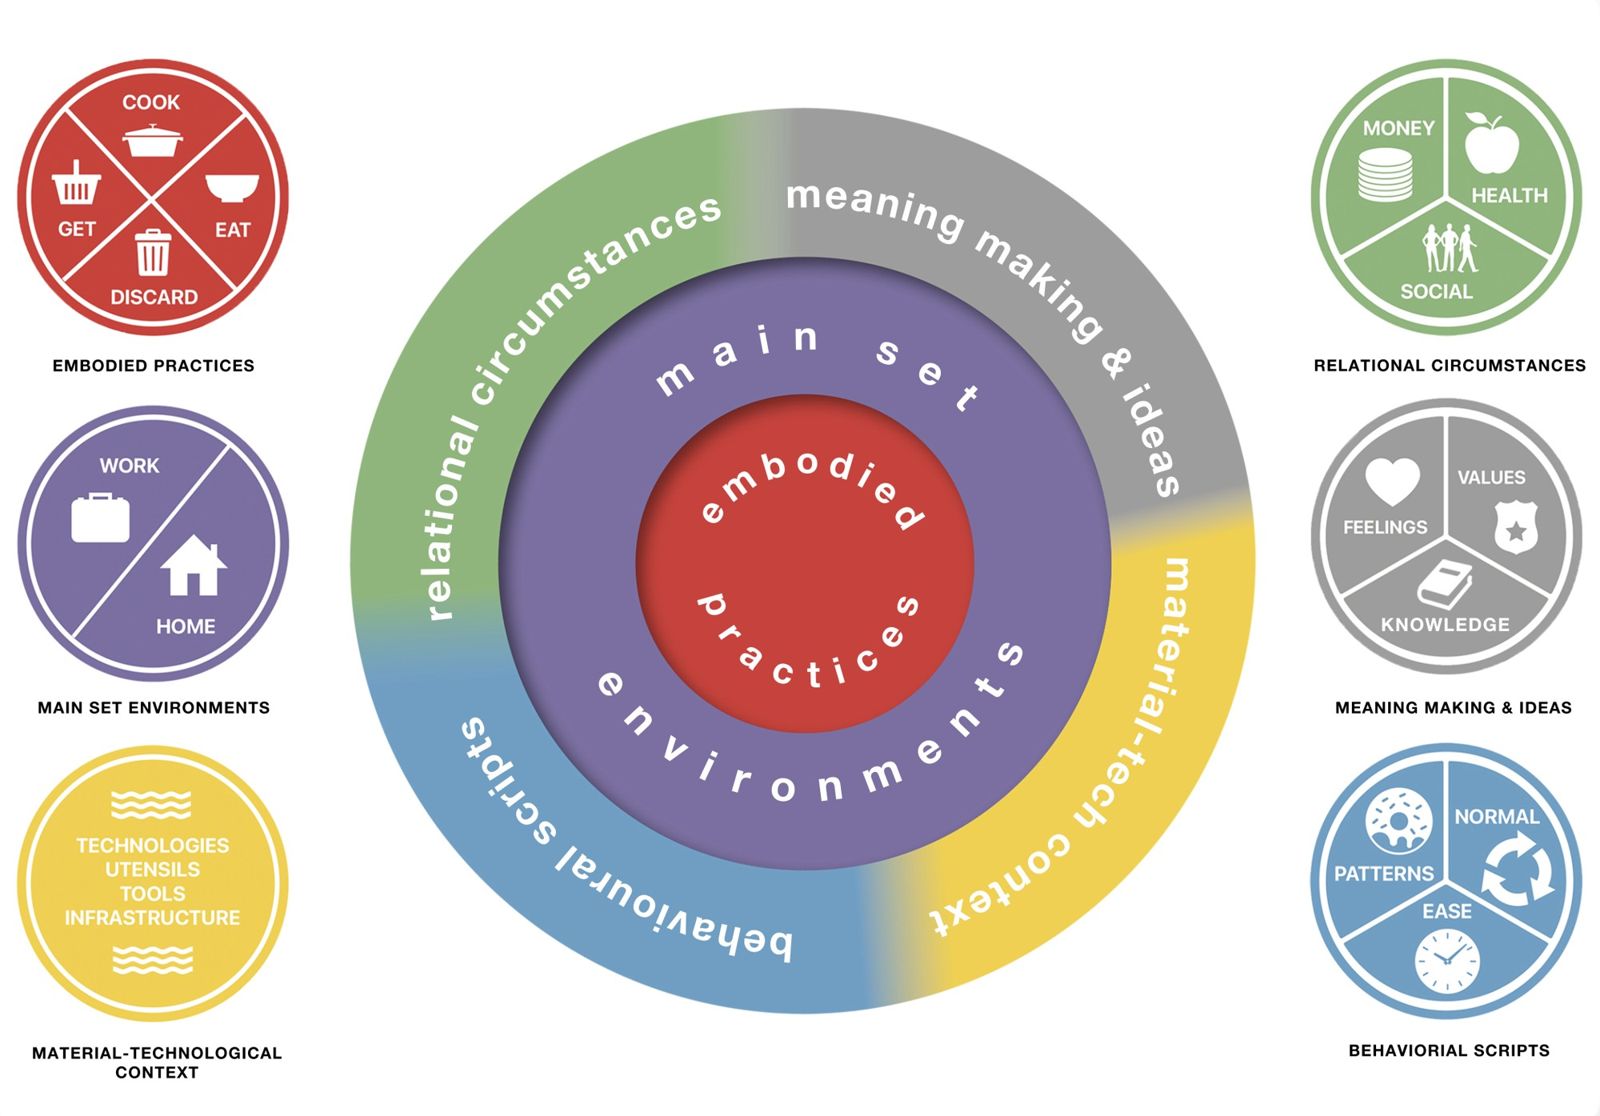
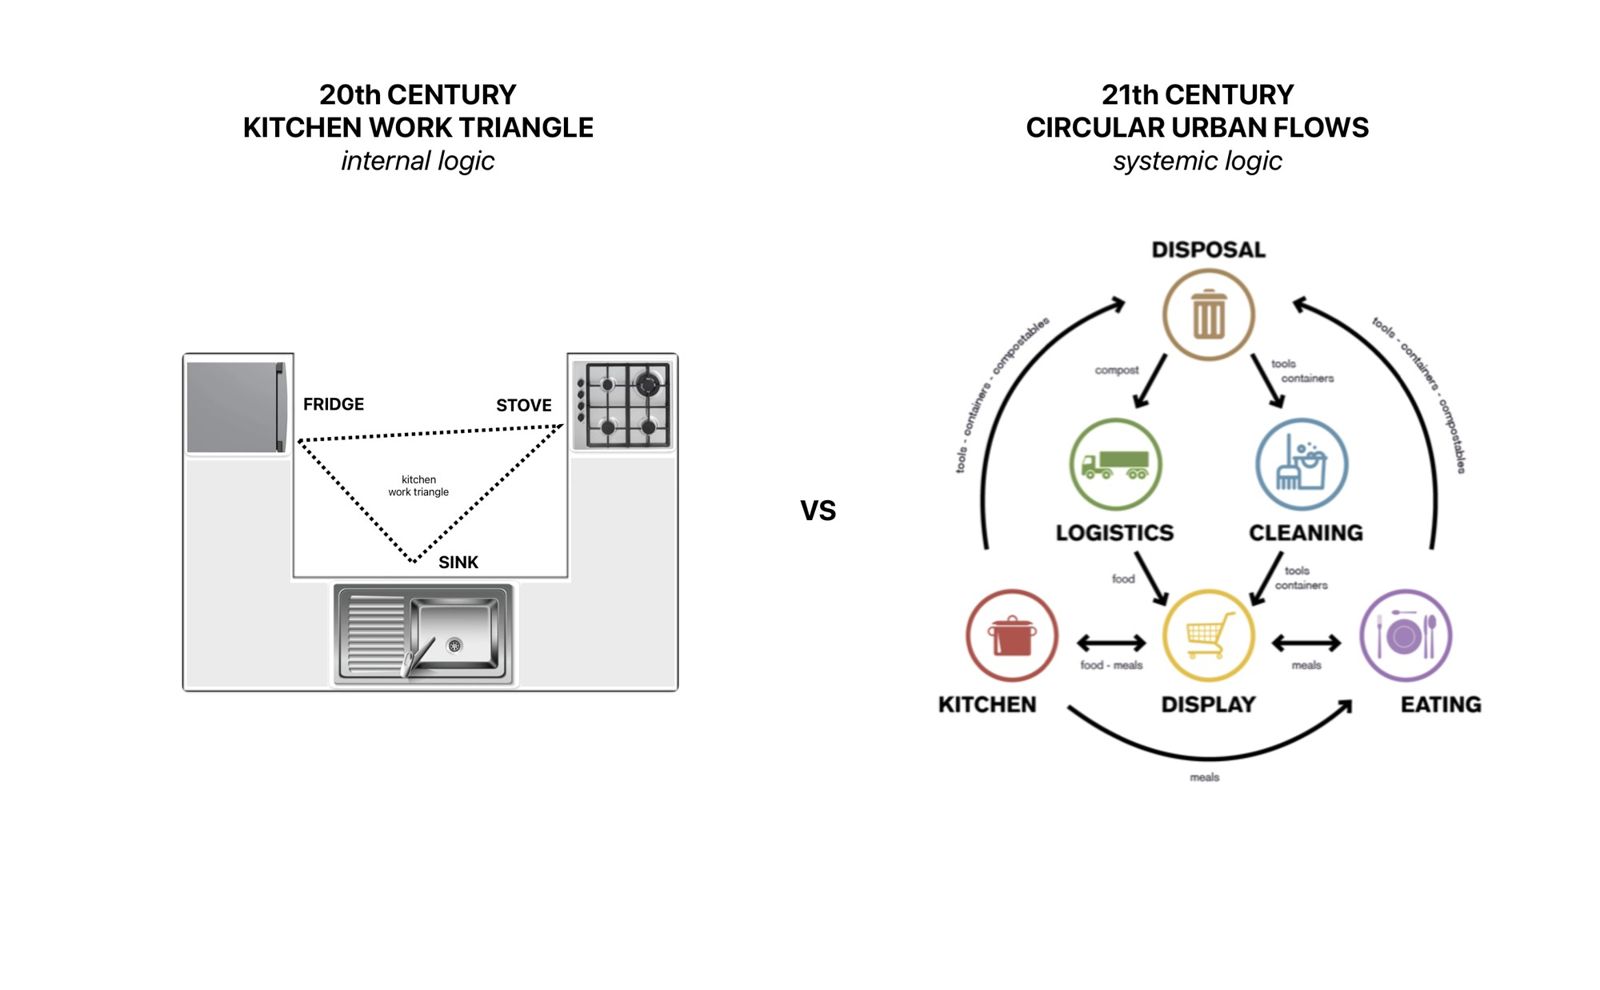
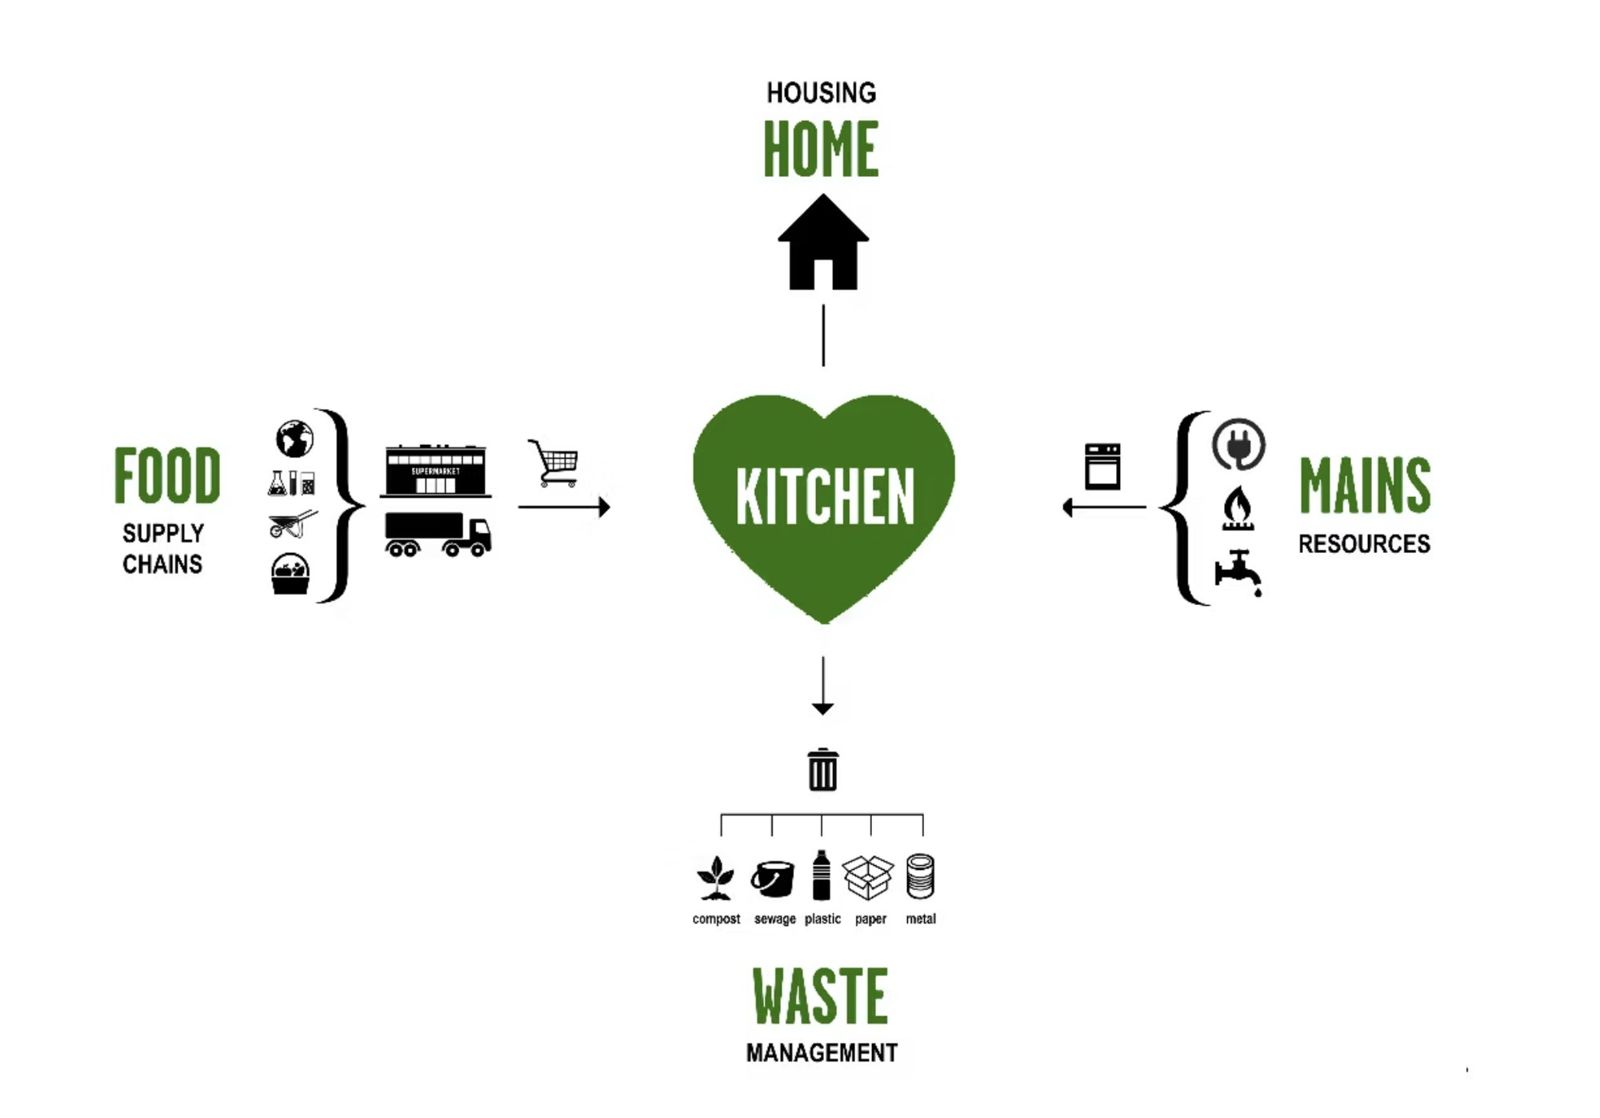
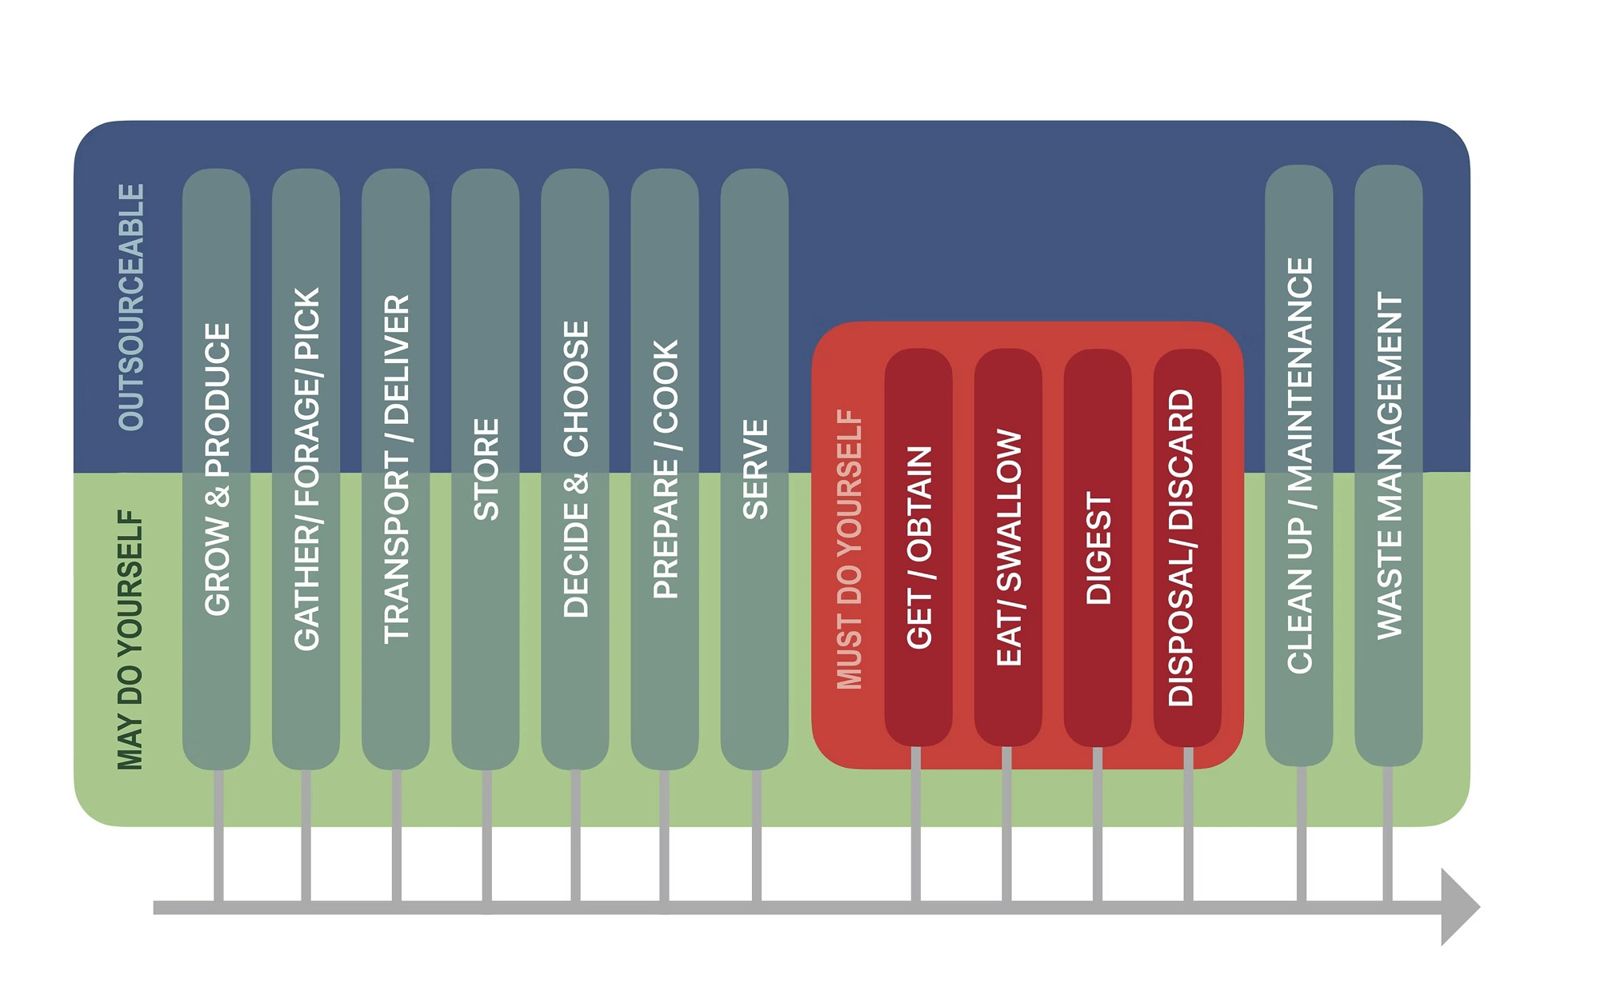
Diagrams, maps & illustrations
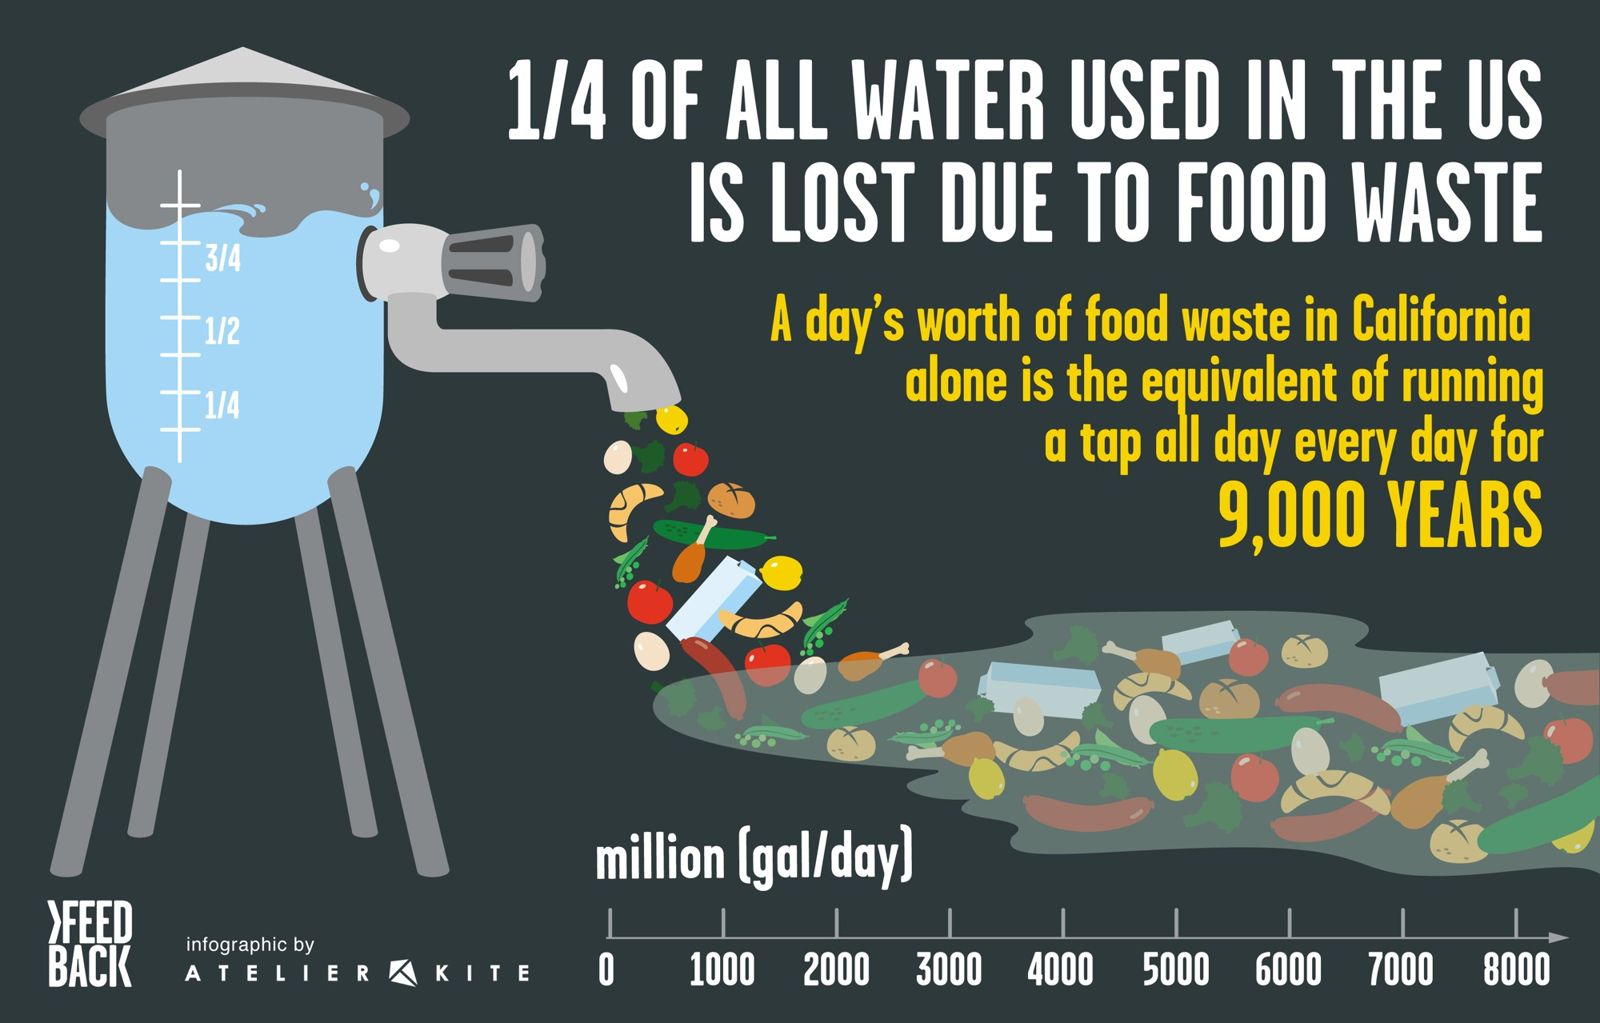
At other times, I find that diagrams, conceptual maps or illustrations work best to capture attention and translate what would be far more difficult to grasp verbally.
04 / 04
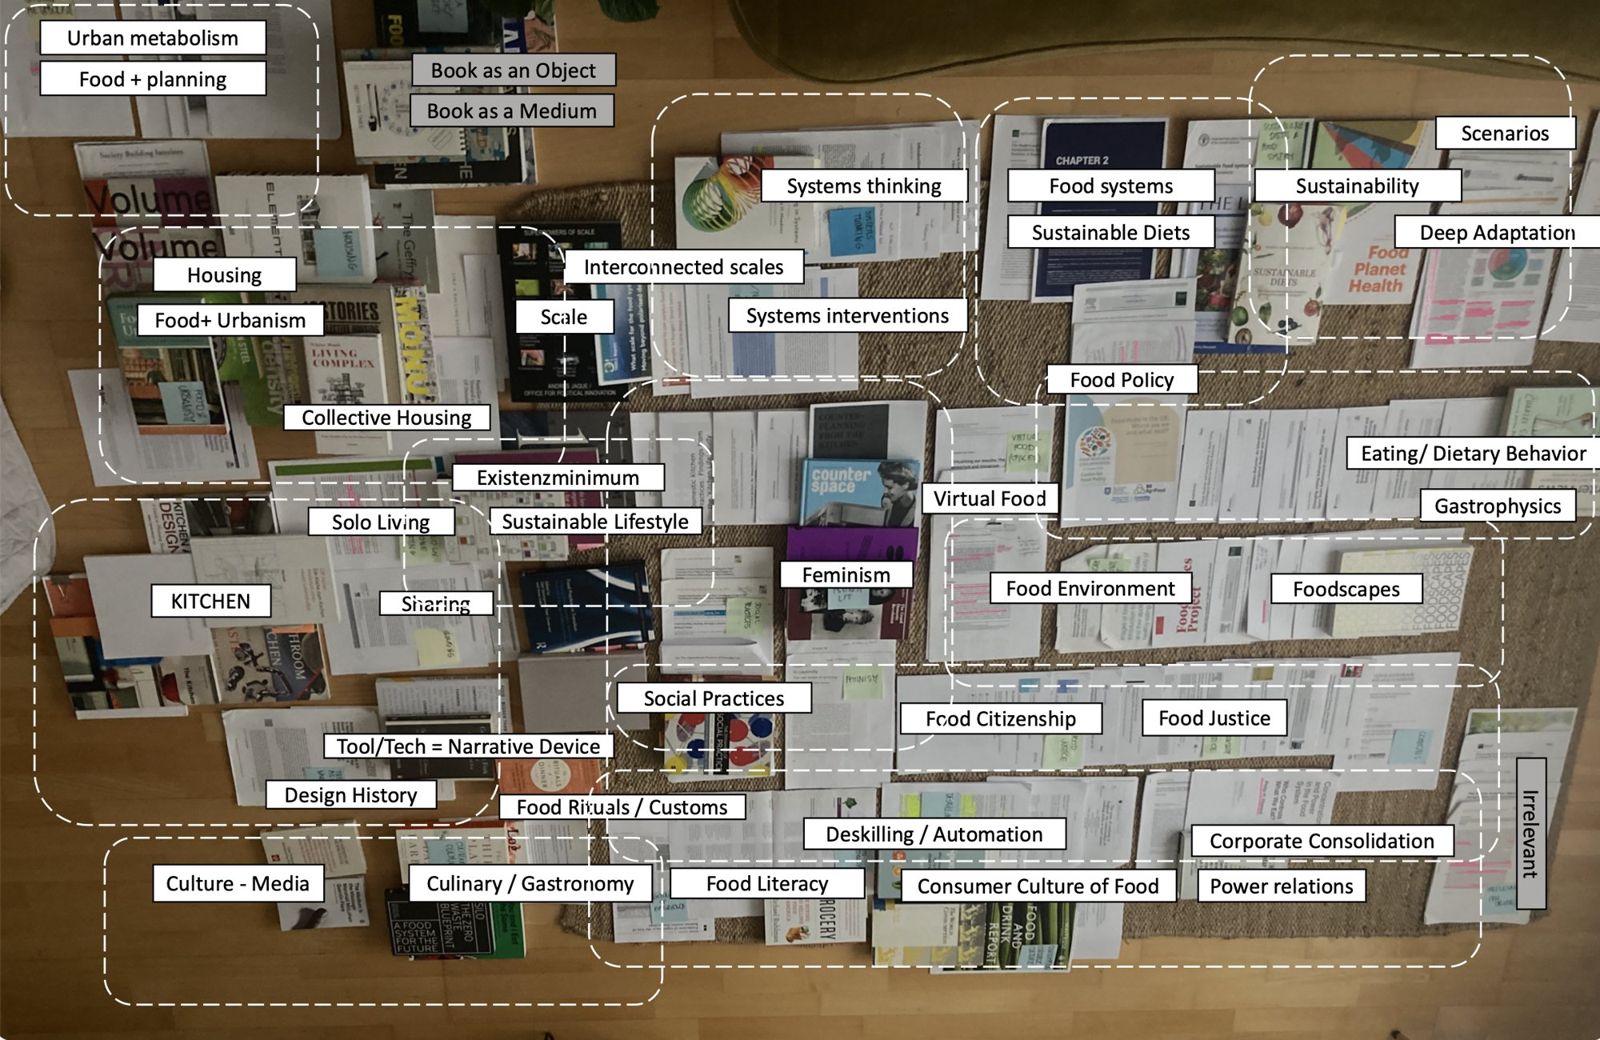
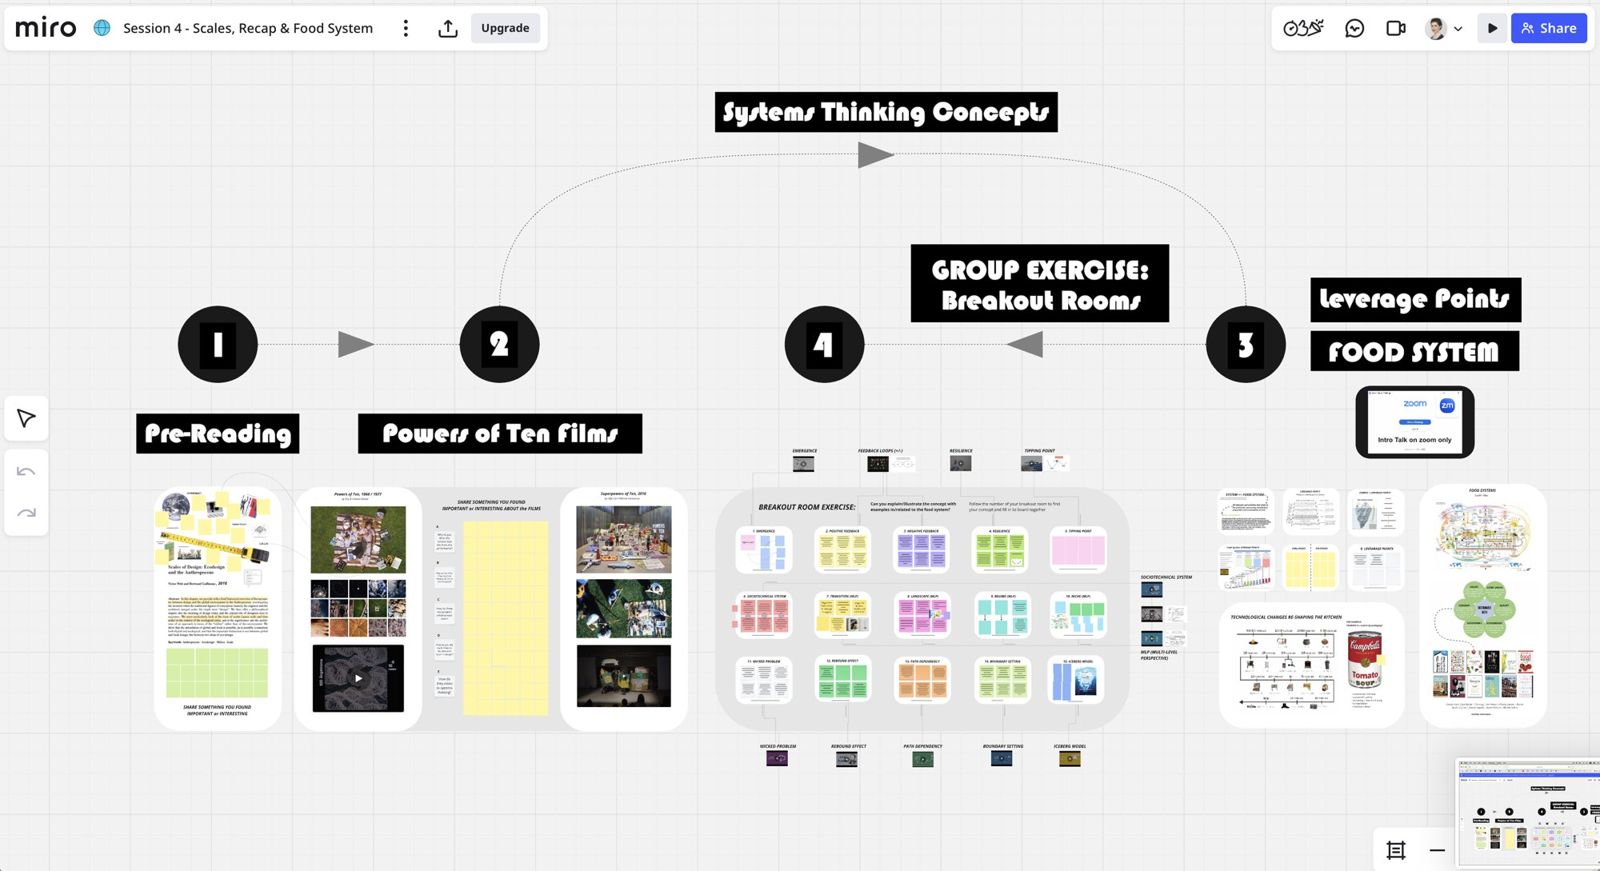
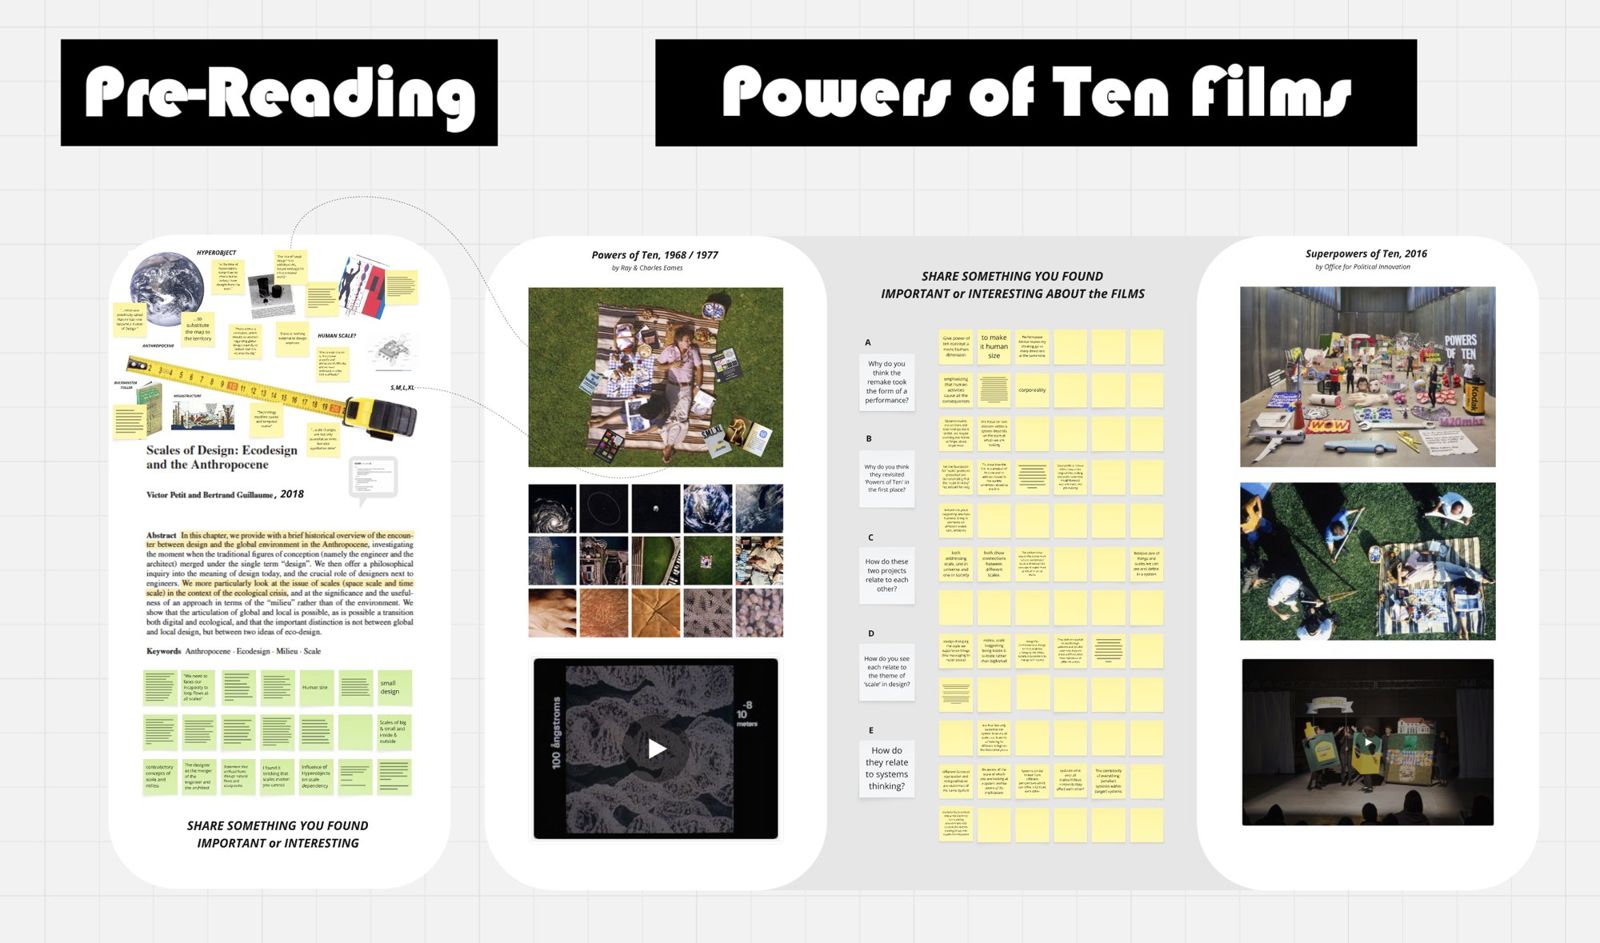
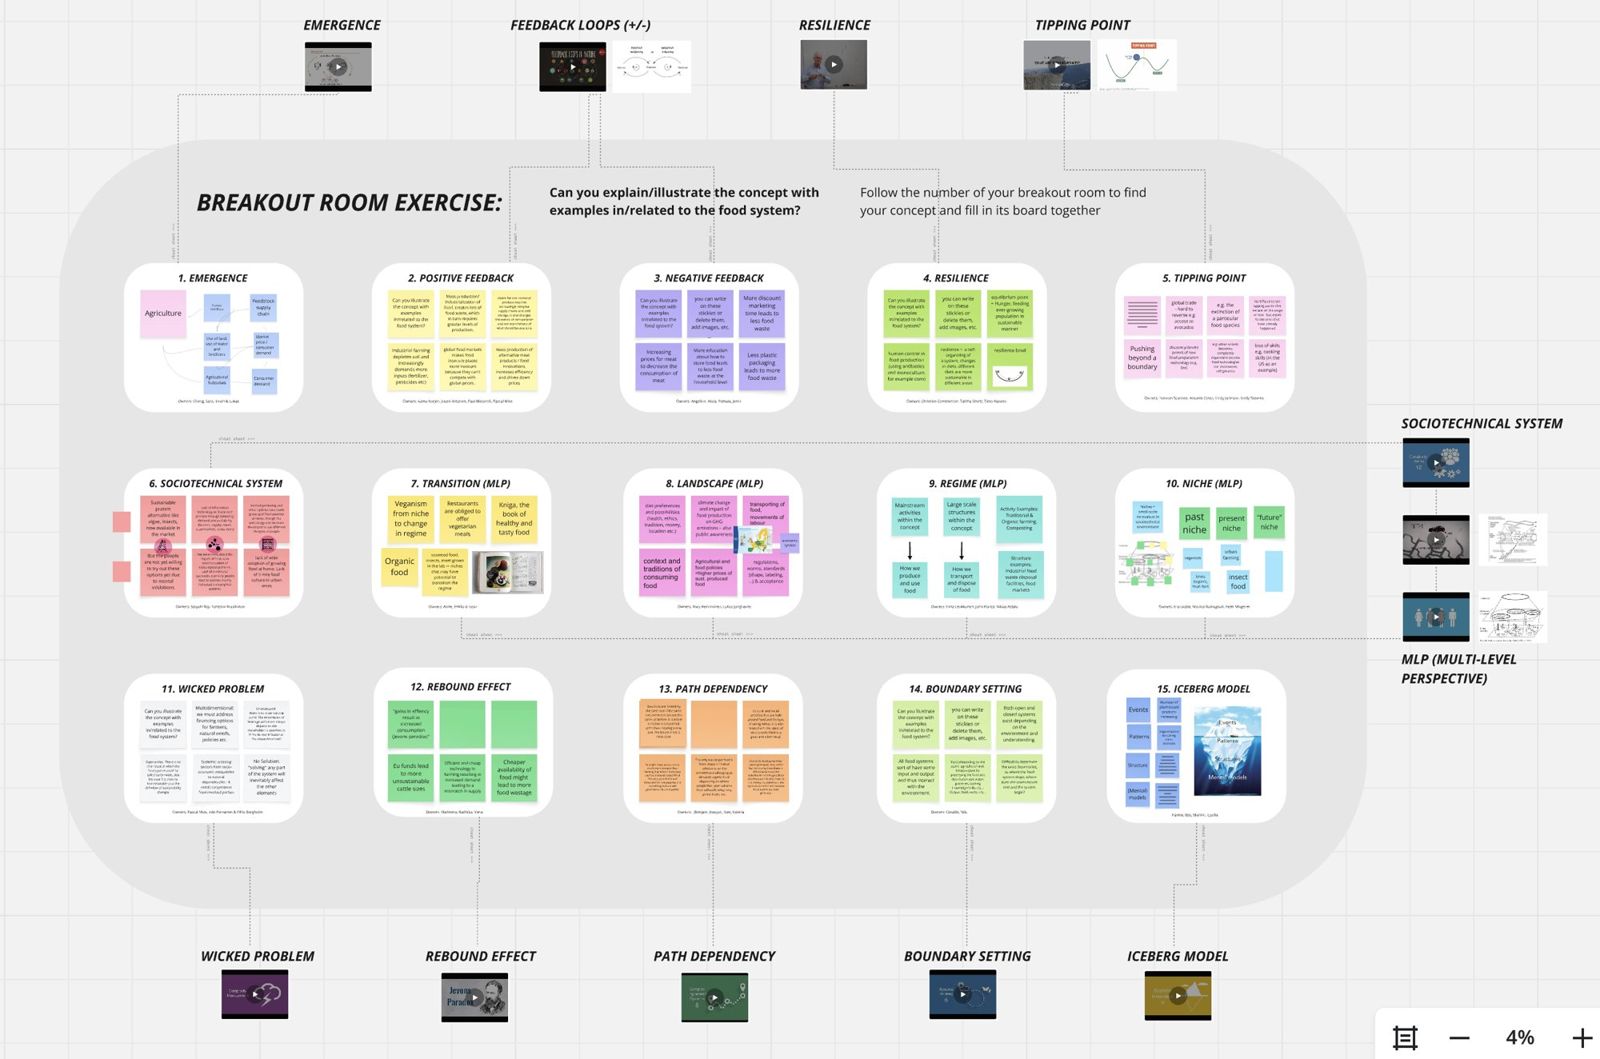
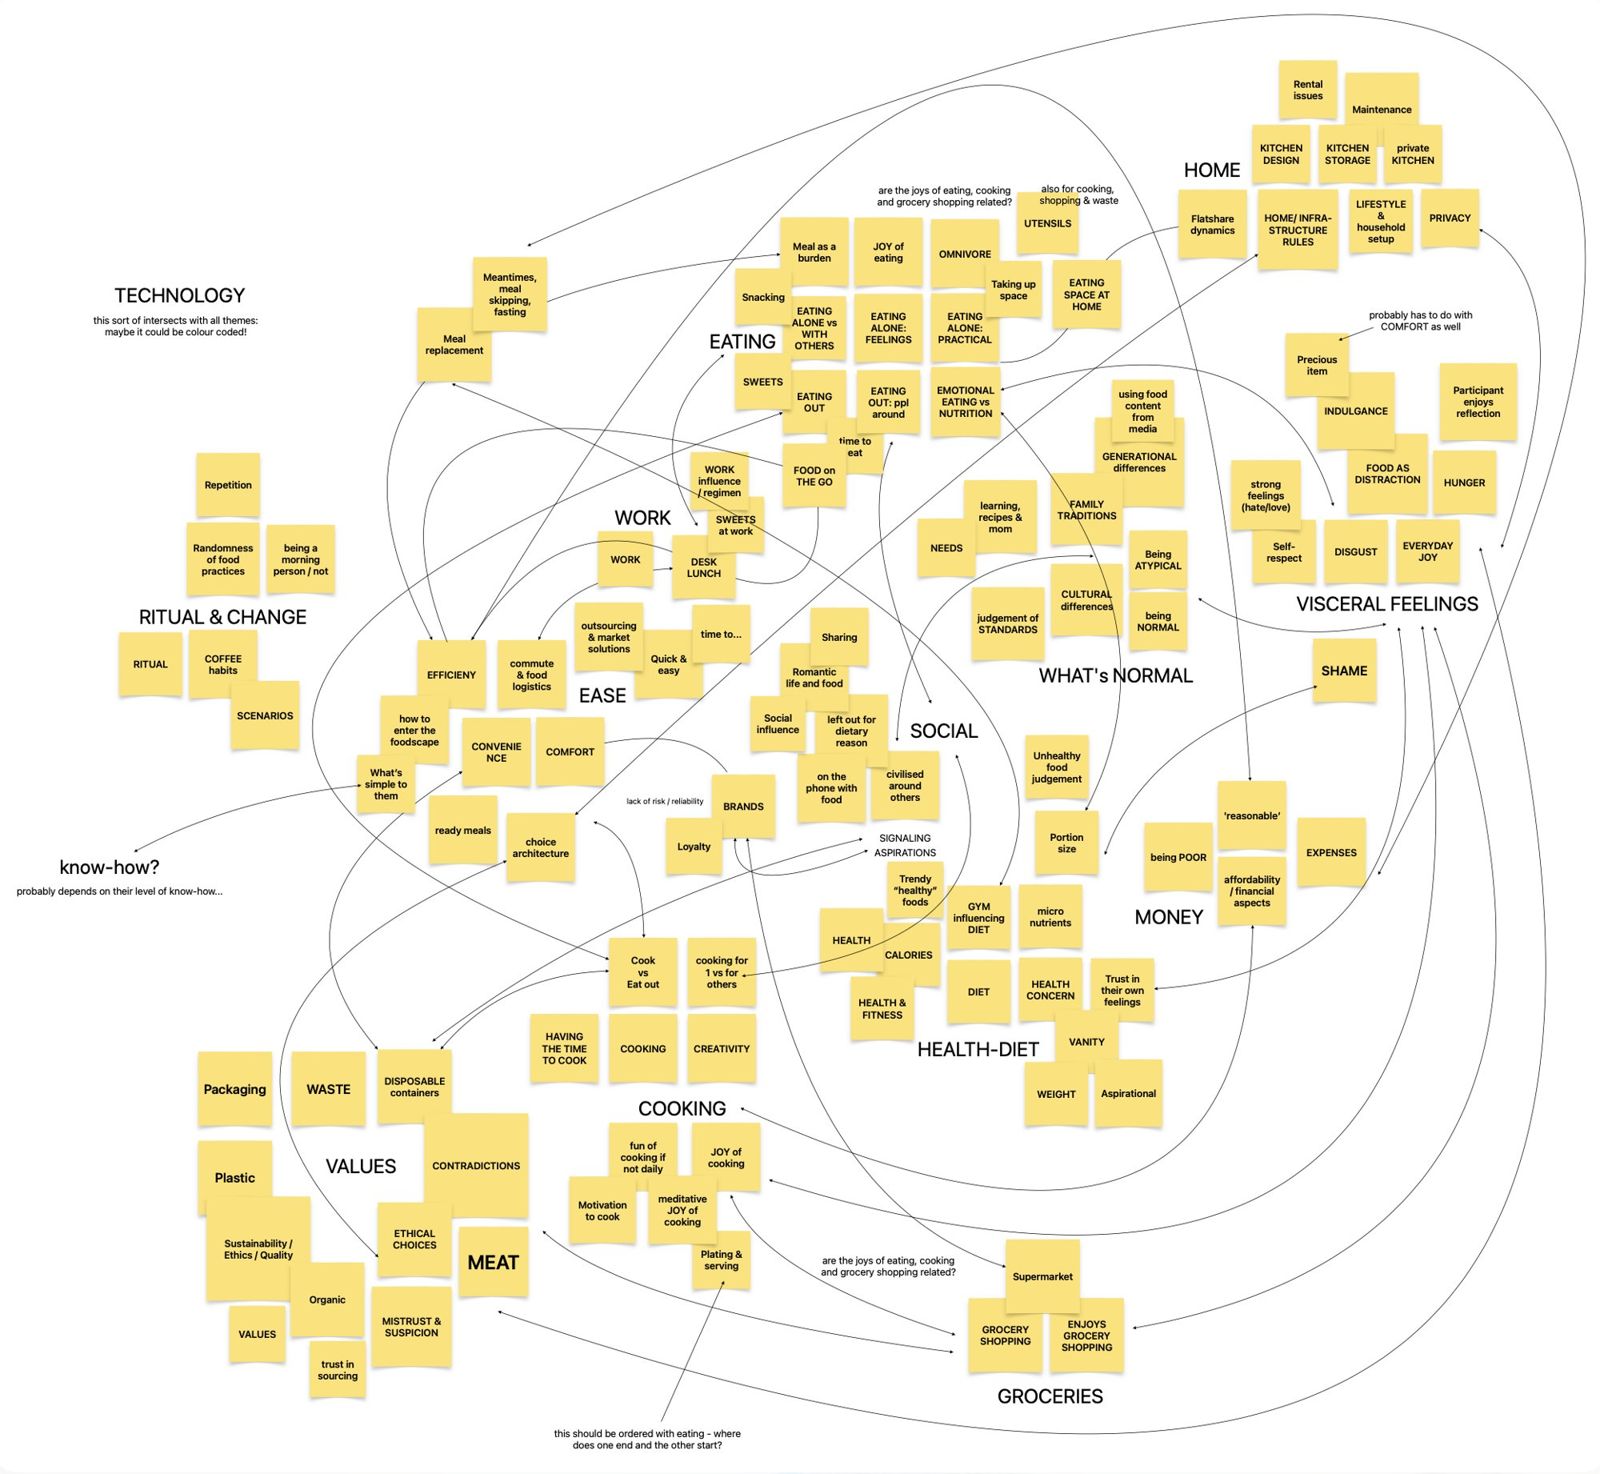
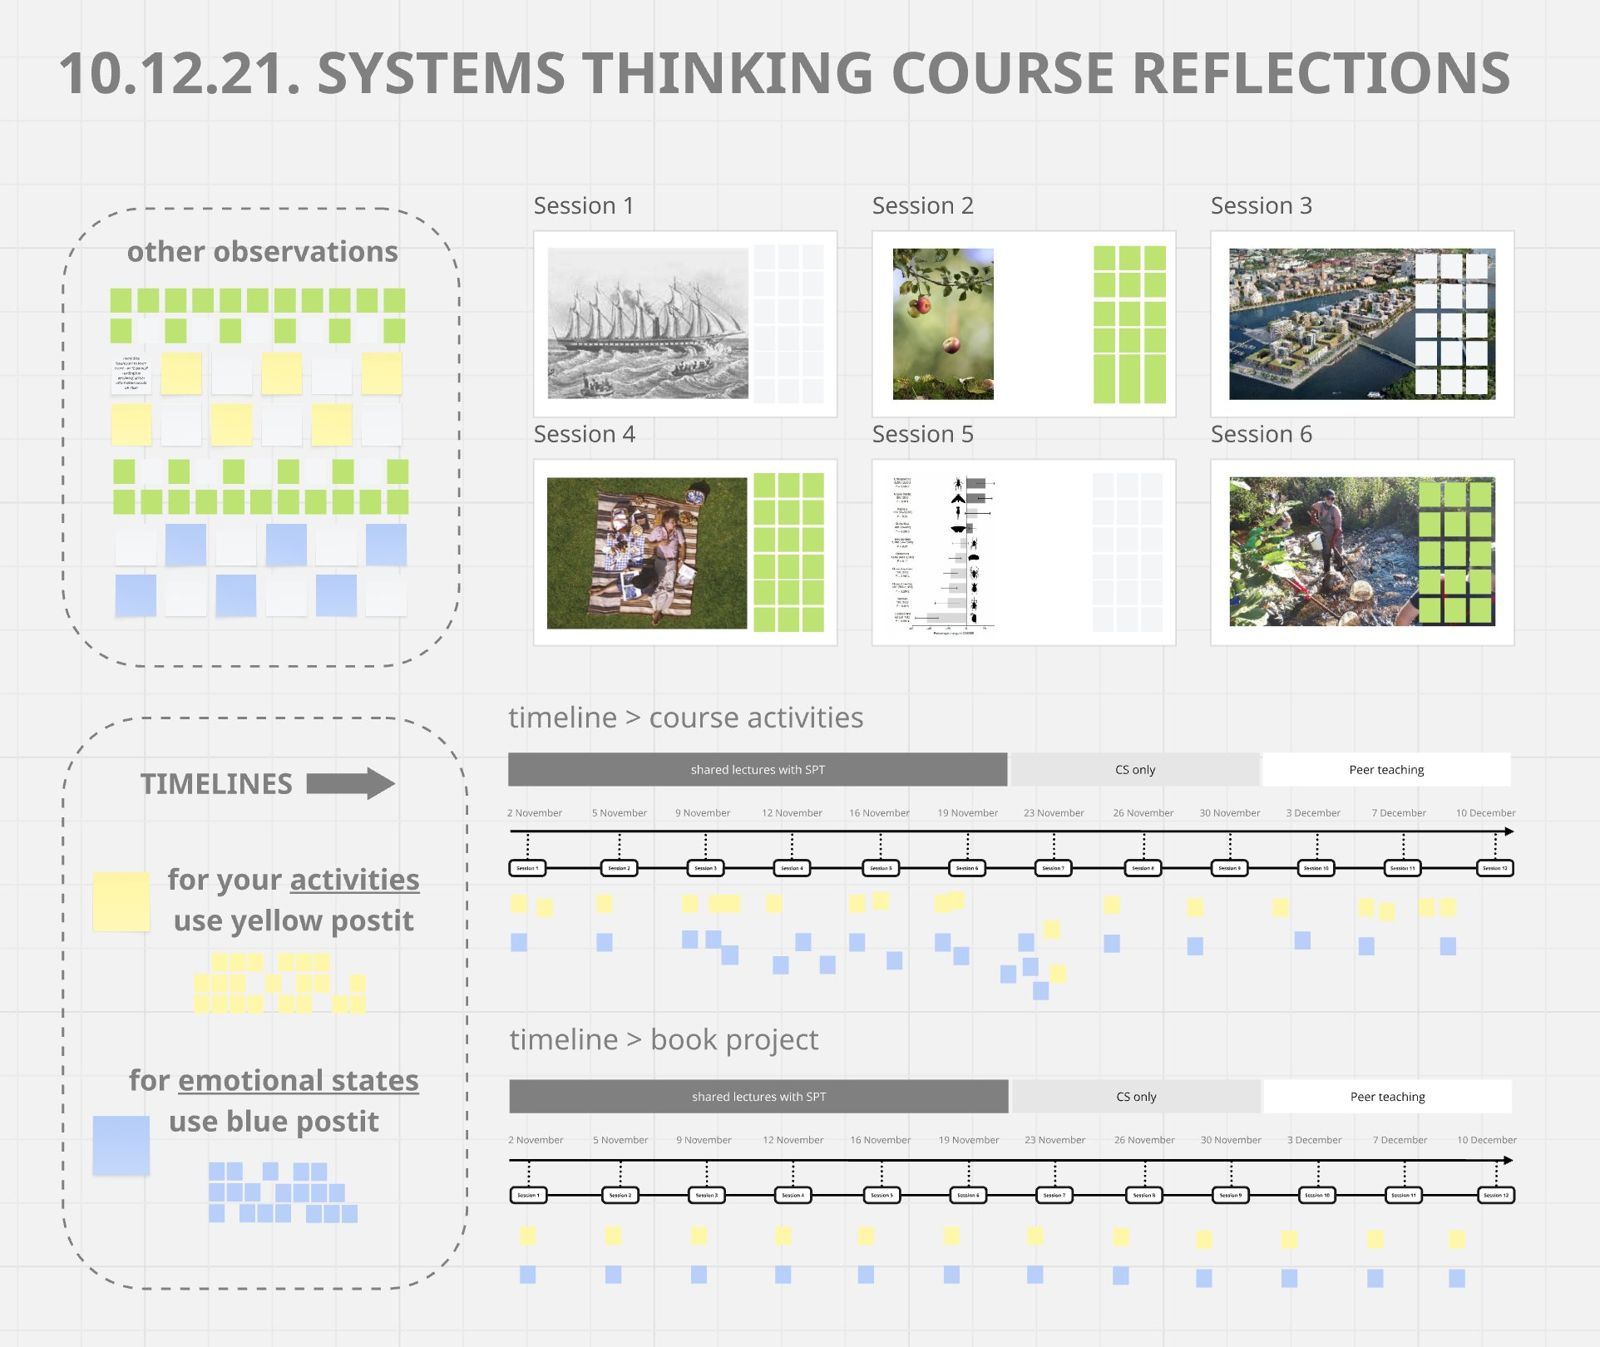
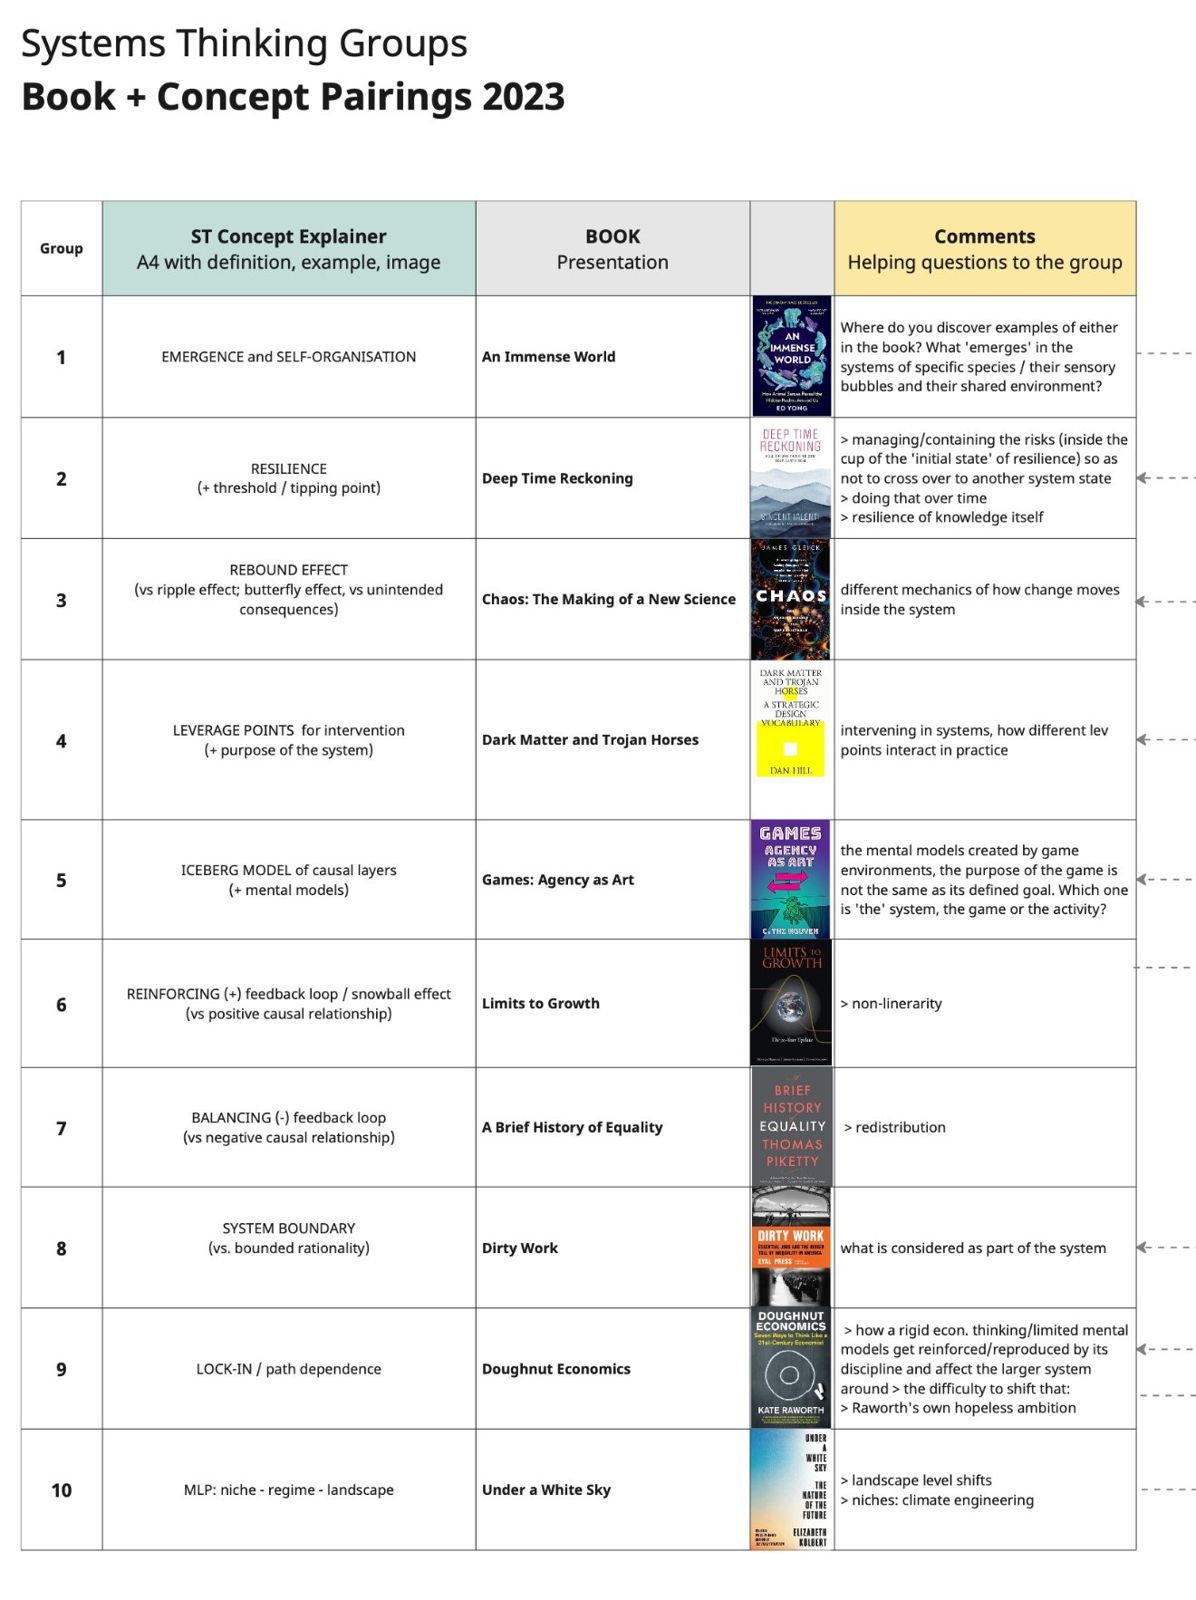
Tools for thinking together
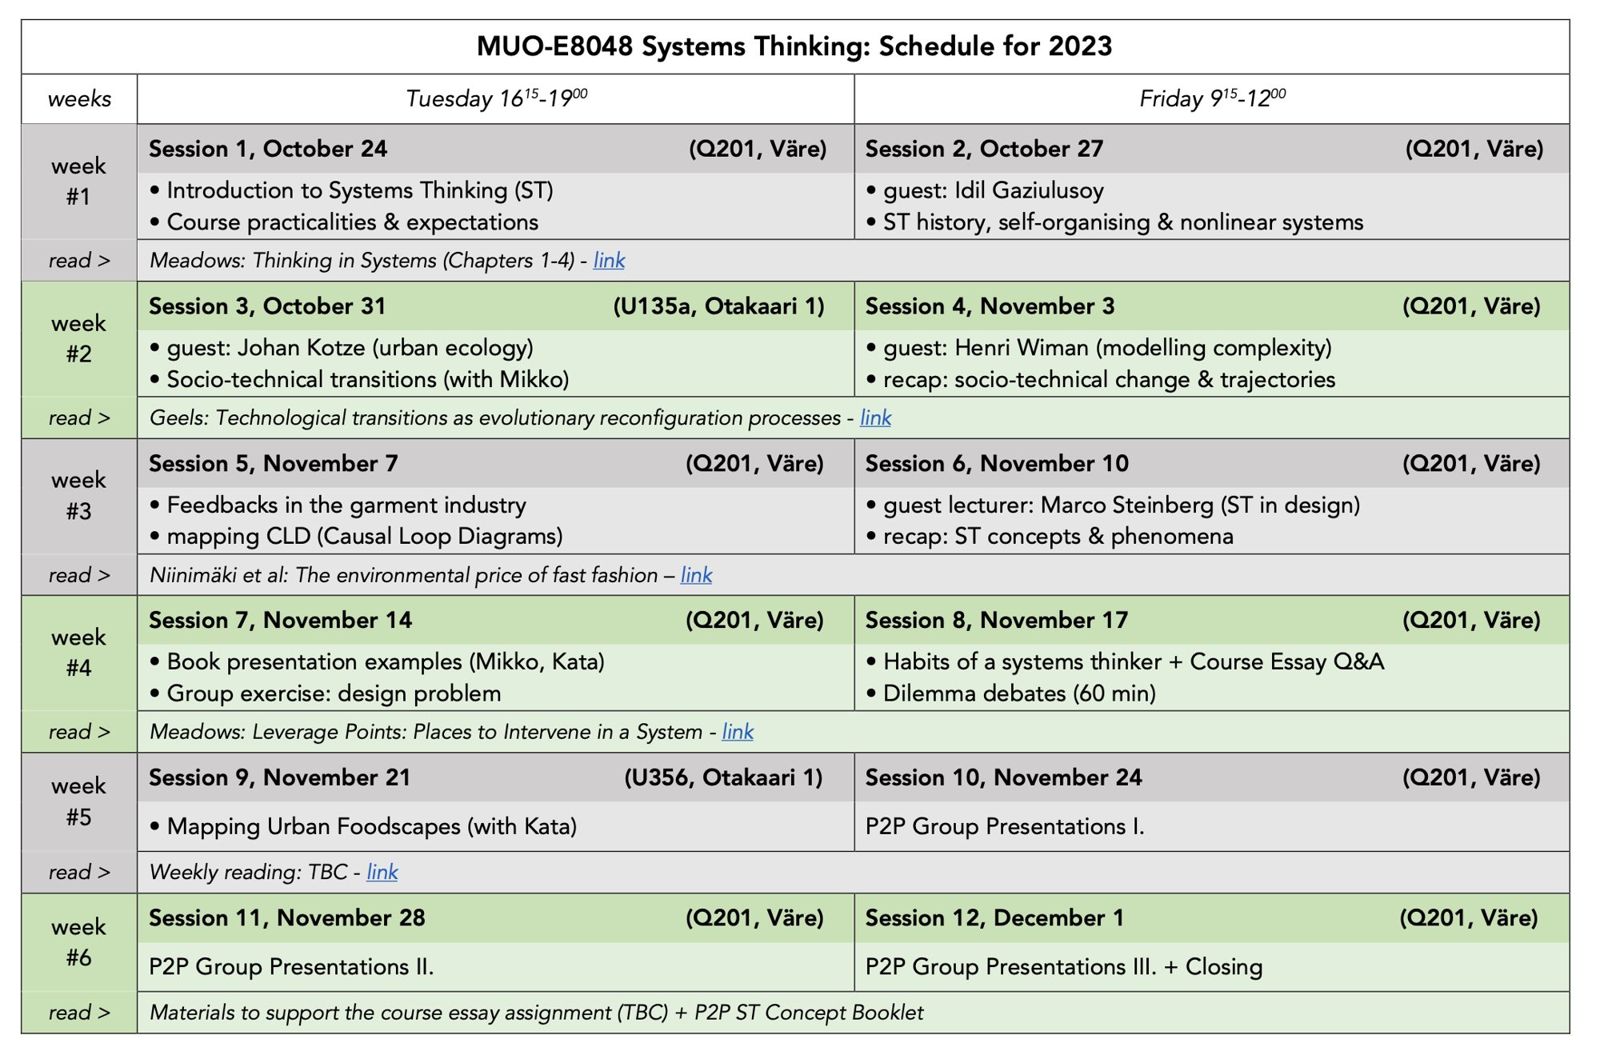
I also constantly use visual sensemaking artefacts as tools and methods for clarifying things for myself and collaborators (e.g. for analysis and organisation), for thinking together and grounding the collaborative development of projects. For example, Miro sessions, tables, mind maps and systems maps.